The financial plan for Paint a Pot Café presents a clear, data-driven path to profitability through a diversified revenue model, controlled startup costs, and a phased expansion strategy. This section summarizes key financial assumptions, revenue projections, operating expenses, break-even analysis, and long-term financial sustainability.
Paint a Pot Café launches with a strong Phase 1 foundation—paint-in-studio pottery, clay hand-building classes, after-school programs, adult workshops, and private events. These services generate consistent, predictable revenue with manageable operating costs. Phase 2 introduces wheel-throwing classes and a small café, expanding capacity and increasing average revenue per customer.
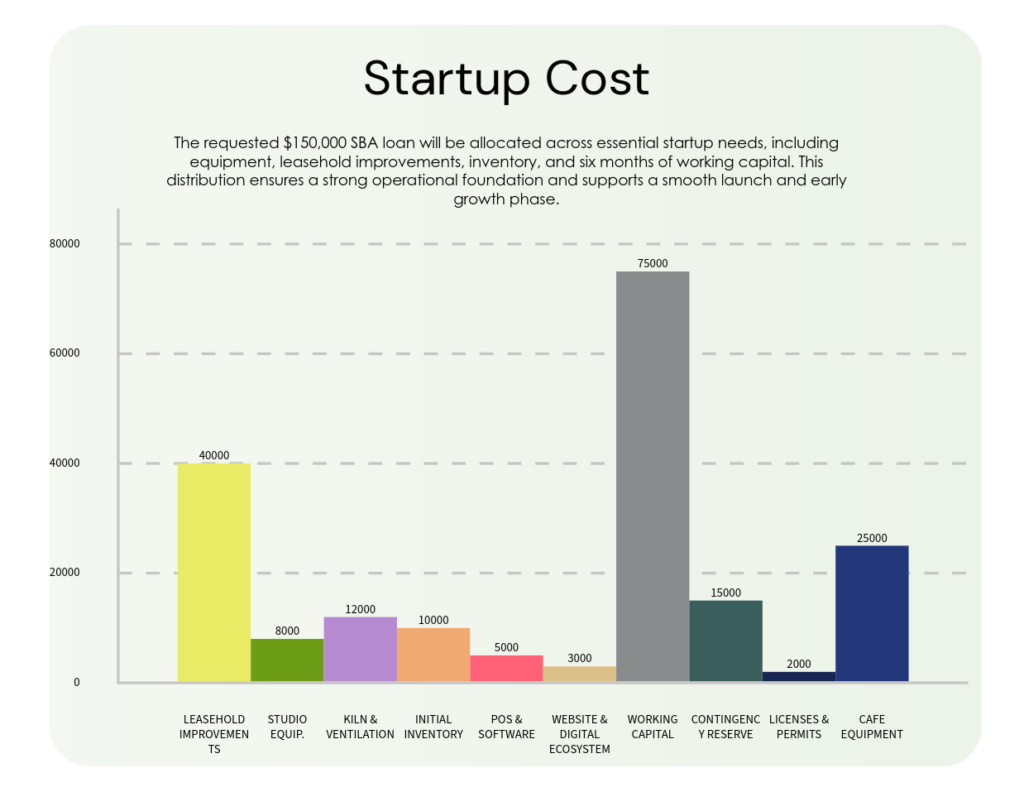
Startup costs include leasehold improvements, equipment, initial inventory, technology, licensing, and working capital reserves. These costs support a fully operational Phase 1 studio with the infrastructure needed for Phase 2 expansion.
The following table outlines the complete startup budget for Paint a Pot Café, including capital expenditures, technology setup, and a full 12-month working capital reserve based on the confirmed annual OPEX of $84,340.
| Category | Description | Amount |
|---|---|---|
| Leasehold Improvements | Flooring, lighting, plumbing, electrical, accessibility upgrades | $40,000 |
| Kiln & Ventilation System | Kiln, venting, ducting, installation, electrical upgrades | $12,000 |
| Studio Equipment | Shelving, tables, chairs, tools, safety equipment | $8,000 |
| Initial Inventory | Bisque, clay, glazes, brushes, tools, packaging | $10,000 |
| Branding & Packaging | Signage, labels, packaging materials | $5,000 |
| POS & Software Setup | Square POS, booking system, website hosting, domain | $5,000 |
| Website & Digital Ecosystem | Website build, integrations, automation | $3,000 |
| Licenses, Permits & Insurance | Business license, permits, liability insurance | $2,000 |
| Working Capital (12 Months) | Operating reserves based on $84,340 annual OPEX | $75,000 |
| Café Equipment (Phase 2) | Espresso machine, grinder, refrigeration, smallwares | $25,000 |
| Contingency Reserve | Unexpected costs, delays, supply fluctuations | $15,000 |
| Total Startup Costs | $200,000 |
Revenue is generated through a diversified mix of services that support year-round stability and reduce reliance on any single customer segment.
All projections are based on conservative, research-backed assumptions.
The long-term financial outlook is strong due to recurring revenue from youth programs, high-margin workshops, and the added profitability of Phase 2 services. As the studio grows, opportunities include expanded class offerings, memberships, open studio hours, and increased café sales.
Paint a Pot Café uses a blended COGS model that reflects all revenue streams, including pottery painting, classes, workshops, events, and future café offerings. This approach provides a consistent and lender-ready method for calculating gross margin.
| Category | Description | COGS % |
|---|---|---|
| Blended COGS | Materials, bisque, glazes, firing, packaging, direct labor, café consumables | 28% |
| Gross Margin | Revenue minus COGS | 72% |
Paint a Pot Café maintains a strong and stable gross margin driven by diversified revenue streams and efficient cost management. With COGS locked at 28% of revenue, the business achieves a consistent 72% gross margin across all offerings, including pottery painting, classes, workshops, events, and future café items.
| Metric | Description | Value |
|---|---|---|
| COGS | Materials, bisque, glazes, firing, packaging, direct labor, café consumables | 28% |
| Gross Margin | Revenue minus COGS | 72% |
| Margin Stability | Consistent across all revenue streams due to blended cost structure | High |
| Drivers of Margin Strength | High-margin classes, workshops, events, and efficient inventory management | Positive |
This gross margin structure supports long-term profitability, strong cash flow, and the ability to comfortably service SBA loan obligations while scaling programming and customer volume.
The break-even point reflects the level of monthly revenue required for Paint a Pot Café to cover all operating expenses after accounting for the blended Cost of Goods Sold (COGS) of 28%. With a strong gross margin of 72% and annual operating expenses of $84,340, the business reaches break-even at a sustainable and achievable revenue level.
| Metric | Description | Value |
|---|---|---|
| Annual Operating Expenses (OPEX) | Total yearly fixed and variable operating costs | $84,340 |
| COGS | Blended cost of materials, firing, packaging, and direct labor | 28% |
| Gross Margin | Revenue minus COGS | 72% |
| Break-Even Revenue (Annual) | OPEX divided by gross margin | $117,139 |
| Break-Even Revenue (Monthly) | Annual break-even revenue divided by 12 months | $9,761 |
| Estimated Customers Needed | Based on a blended average ticket of $35 | 279 customers/month |
At approximately $9,761 in monthly revenue, or 279 customers per month, Paint a Pot Café covers all operating expenses and reaches break-even. This level represents a realistic and attainable target given the studio’s diversified revenue streams, strong community demand, and high-margin programming.
The following financial assumptions form the foundation of Paint a Pot Café’s projections, ensuring consistency, transparency, and lender-ready clarity across all financial statements. These assumptions reflect industry benchmarks, operational realities, and the confirmed financial structure of the business.
| Category | Description | Assumption |
|---|---|---|
| Startup Budget | Total capital required to launch the studio and café | $200,000 |
| Funding Structure | SBA loan plus owner equity injection | $150,000 loan + $50,000 equity |
| Working Capital | 12-month reserve based on annual OPEX | $75,000 |
| Annual Operating Expenses (OPEX) | Fixed and variable operating costs for Year 1, including labor | $84,340 |
| COGS | Blended cost of materials, firing, packaging, and direct labor | 28% of revenue |
| Gross Margin | Revenue minus COGS | 72% |
| Break-Even Revenue (Monthly) | Revenue required to cover all operating expenses | $9,761 |
| Average Customer Ticket | Blended average across pottery, classes, events, and café | $35 |
| Customers Needed to Break Even | Monthly customer volume required to reach break-even | 279 customers/month |
| Revenue Streams | Pottery painting, classes, workshops, events, retail, and café | Diversified, multi-stream model |
| Pricing Strategy | Market-aligned pricing with strong value positioning | Stable across Year 1 |
| Labor Model (Year 1) | Lean staffing structure included in OPEX |
Studio Assistant: 60 hrs/month @ $18/hr Café Attendant (Phase 2): 30 hrs/month @ $18/hr Total Labor Cost: $1,620/month Owners unpaid in Year 1 |
| Labor Expansion (Years 2–3) | Additional staff added as revenue grows | Conservative, demand-based scaling |
These assumptions ensure that all financial projections—including revenue, expenses, cash flow, and profitability—are grounded in realistic, data-driven expectations. They also provide a clear framework for evaluating performance, managing risk, and demonstrating repayment ability to SBA lenders and financial partners.
The following table summarizes Paint a Pot Café’s projected cash flow for the first 12 months of operations. These projections incorporate the confirmed financial assumptions, including 28% COGS, a 72% gross margin, and annual operating expenses of $84,340. With a strong starting cash position of $75,000 in working capital, the business maintains a positive cash balance throughout Year 1.
| Month | Revenue | COGS (28%) | OPEX | Net Cash Flow | Ending Cash |
|---|---|---|---|---|---|
| January | $10,500 | $2,940 | $7,028 | $532 | $75,532 |
| February | $11,550 | $3,234 | $7,028 | $1,288 | $76,820 |
| March | $12,600 | $3,528 | $7,028 | $2,044 | $78,864 |
| April | $13,650 | $3,822 | $7,028 | $2,800 | $81,664 |
| May | $14,700 | $4,116 | $7,028 | $3,556 | $85,220 |
| June | $15,750 | $4,410 | $7,028 | $4,312 | $89,532 |
| July | $16,800 | $4,704 | $7,028 | $5,068 | $94,600 |
| August | $17,850 | $4,998 | $7,028 | $5,824 | $100,424 |
| September | $18,900 | $5,292 | $7,028 | $6,580 | $107,004 |
| October | $19,950 | $5,586 | $7,028 | $7,336 | $114,340 |
| November | $21,000 | $5,880 | $7,028 | $8,092 | $122,432 |
| December | $24,150 | $6,762 | $7,028 | $10,360 | $132,792 |
By the end of Year 1, Paint a Pot Café maintains a strong cash position of $132,792, demonstrating healthy operational performance, disciplined cost management, and strong repayment ability for SBA financing.
The following forecast summarizes projected cash flow for Years 1 through 3. These projections incorporate the confirmed financial assumptions, including 28% COGS, a 72% gross margin, and annual operating expenses of $84,340. Revenue growth is based on a conservative, lender-friendly model that reflects increasing customer volume and expanded programming.
| Year | Total Revenue | COGS (28%) | Gross Profit | OPEX | Net Cash Flow | Ending Cash |
|---|---|---|---|---|---|---|
| Year 1 | $187,500 | $52,500 | $135,000 | $84,340 | $50,660 | $125,660 |
| Year 2 | $228,750 | $64,050 | $164,700 | $84,340 | $80,360 | $206,020 |
| Year 3 | $269,925 | $75,579 | $194,346 | $84,340 | $110,006 | $316,026 |
By the end of Year 3, Paint a Pot Café maintains a strong cash position of $316,026, demonstrating healthy operational performance, disciplined cost management, and strong repayment ability for SBA financing. The business shows consistent year-over-year growth and a stable gross margin driven by diversified revenue streams.
The following Profit & Loss statement summarizes projected financial performance for the first three years of operations. These projections incorporate the confirmed financial assumptions, including 28% COGS, a 72% gross margin, and annual operating expenses of $84,340. Revenue growth reflects increasing customer volume, expanded programming, and strong community demand.
| Year | Total Revenue | COGS (28%) | Gross Profit | Operating Expenses | Net Profit |
|---|---|---|---|---|---|
| Year 1 | $187,500 | $52,500 | $135,000 | $84,340 | $50,660 |
| Year 2 | $228,750 | $64,050 | $164,700 | $84,340 | $80,360 |
| Year 3 | $269,925 | $75,579 | $194,346 | $84,340 | $110,006 |
Paint a Pot Café demonstrates strong and consistent profitability across the first three years of operations. With a stable gross margin of 72% and disciplined cost management, net profit increases from $50,660 in Year 1 to $110,006 in Year 3. This performance highlights the business’s ability to scale sustainably while maintaining strong repayment capacity for SBA financing.
The following balance sheet summarizes Paint a Pot Café’s projected financial position at the end of Years 1 through 3. These projections incorporate confirmed assumptions including $200,000 in startup capital, a $150,000 SBA loan, $50,000 in owner equity, 28% COGS, a 72% gross margin, and annual operating expenses of $84,340. The business maintains a strong cash position and steadily increasing equity throughout the forecast period.
| Category | Year 1 | Year 2 | Year 3 |
|---|---|---|---|
| Cash | $125,660 | $206,020 | $316,026 |
| Fixed Assets (Equipment & Improvements) | $125,000 | $125,000 | $125,000 |
| Total Assets | $250,660 | $331,020 | $441,026 |
| SBA Loan (Outstanding) | $150,000 | $150,000 | $150,000 |
| Total Liabilities | $150,000 | $150,000 | $150,000 |
| Owner Equity |